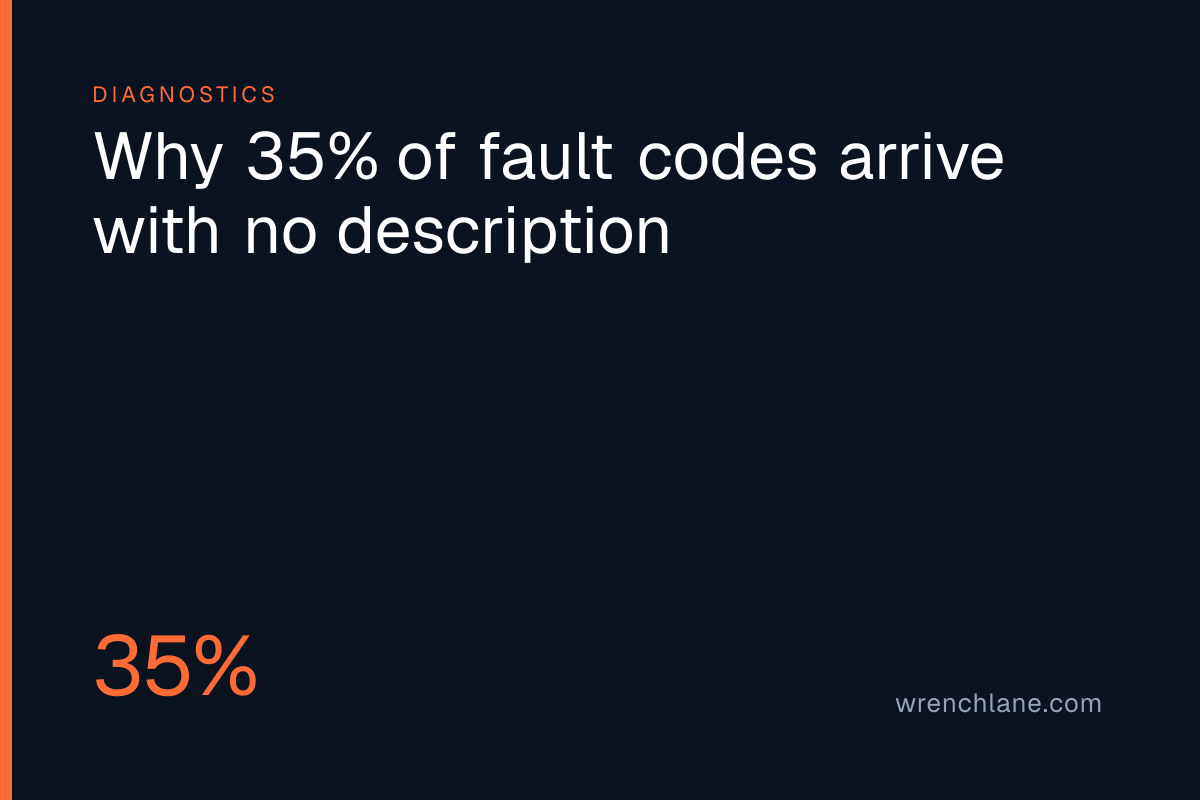
In our own platform data from February to September 2026, 35 percent of all coded diagnostics arrived with just a raw string of characters and zero text description. Out of 1632 diagnostics that returned at least one readable fault code, 574 were completely blank aside from the alphanumeric string itself. A technician pulling codes in a bay is frequently flying completely blind from step one.
The reality of scanner output
We often assume that a scanner gives a mechanic a clear starting point. The reality on the shop floor is much messier. Between February 18 and September 8, workshops ran 2957 total diagnostics through the diagnostic platform we build. Only 55 percent of those, exactly 1632 sessions, carried at least one readable fault code.
The fact that 35 percent of those coded sessions lacked any manufacturer description reveals a major gap in daily operations. Mechanics are regularly forced to step away from the vehicle just to translate a raw string of text into a physical component. When you look at the monthly breakdown, this remains a consistent structural issue rather than an isolated anomaly. In August 2026, mechanics ran 472 diagnostics, with 245 returning codes, logging 444 individual code instances. The sheer volume of raw data hitting a workshop floor requires more than a simple lookup table.
Diagnosing in clusters
The data also dismantles the idea of a single smoking gun. Across the 1632 coded diagnostics in our dataset, the average number of codes per vehicle was 1.65. Multi-code diagnostics made up 29 percent of the total, representing 466 distinct cases.
This matters because fault codes do not exist in isolation. When a failing ground connection triggers a cascade of secondary electrical faults, diagnosing the first code you see is a trap. Pattern-level diagnosis requires seeing these clusters together. Across the entire window, we recorded 1143 distinct base fault codes spread across 2685 total instances. You cannot memorize how 1143 distinct codes interact with each other across different vehicle architectures.
Building a pattern history
Aggregate scale changes how a workshop operates. If a technician sees an average of 1.65 codes per vehicle, and a massive chunk of those codes lack a description, the old method of pasting a string into a search engine simply wastes bay time. In June 2026, workshops logged 560 diagnostics, our highest month in the window, pulling 432 code instances from 300 coded sessions. The volume of data generated by a small group of mechanics is immense. The bay requires a system that reasons over these clusters and compares them to past outcomes rather than treating each code as an isolated event.
A familiar problem
What does the split look like in your own bay?